This is the forum archive of Homey. For more information about Homey, visit the Official Homey website.
The Homey Community has been moved to https://community.athom.com.
This forum is now read-only for archive purposes.
The Homey Community has been moved to https://community.athom.com.
This forum is now read-only for archive purposes.
[ Published ] Winddelen production tracking app
I have just published an app to display and track the energy production of 'Winddelen' from the Windcentrale https://www.windcentrale.nl/. The Windcentrale is a cooperation that operates ten windmills you can buy shares ('winddelen') in.
After installing the app, you can select a windmill and the number of shares, and off you go.
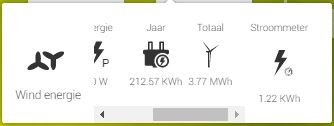
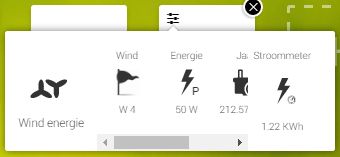
Apart from a mobile view (see below), the app allows Homey to track the current, daily, yearly and lifetime production of your 'winddelen' and plot them in the insights view. Other data can be collected from the Windcentrale API as well, for instance monthly production, or the % of the yearly target can be calculated. Let me know what you would like to see (and why ;-) so I can use it to improve the app.
Initially I wrote the app as a driver for the 'Solar panels' app. However, I then decided to make a dedicated app as I wanted to mess around with it a bit more


Comments
Thanks for the effort of developing the App!