This is the forum archive of Homey. For more information about Homey, visit the Official Homey website.
The Homey Community has been moved to https://community.athom.com.
This forum is now read-only for archive purposes.
The Homey Community has been moved to https://community.athom.com.
This forum is now read-only for archive purposes.
Best strategy to identify cause for large swap - or whatever it is that's making the system sluggish
 cbh
Member
cbh
Member
Hi,
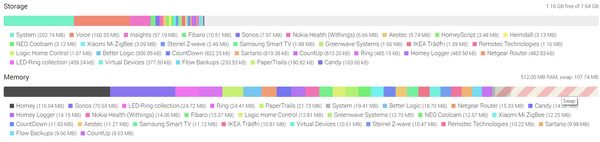
noticed my system is building a large swap file - and it seems like the system is congested from time to time.
Homey fw 1.5.6-rc7
All apps updated to newest version (beta in case that's available)
Looked at the z-wave log at developer.athom.com and Homey Logger in order to identify processes "running wild" - but it is somewhat difficult to figure out when much is too much...
Any advice on how the best way is to identify the cause?
Disabling all apps and then enable them each after each and see what happens?
Same strategi for flows?
Or something else?
All suggestions welcome!
Regards,
Chr.
Comments
For me it workes fine:
https://forum.athom.com/discussion/comment/64670/#Comment_64670
However, if possible, I'd like to find the cause and look into the origin instead of having to reboot the system frequently...
my Homey did crash already once because of the swap size (i think)
You can loop through the installed apps like this:
const apps = await Homey.apps.getApps( );

let totalSwap = 0;
_.forEach(apps, (app) => {
    totalSwap += app.usage.swapPss;
    console.log(app.id + ', pss: ' + app.usage.pss  + ', swapPss: ' + app.usage.swapPss + ', mem: ' + app.usage.mem + ', total: ' + (app.usage.swapPss + app.usage.pss));

    //console.log(a);
})
console.log('totalSwap: ' + (totalSwap / (1024*1024)) + 'MB')
Now, i'am a little unsure what the meaning is of swapPss and pss. But as you can see the total of these values equals <mem>
The last line (totalSwap is not the same as the swap you see in the system page. This is because this code only count the installed apps, not swap space used by Homey itself
swapPss has something to do with swap space usage. Maybe someone knows enough from linux to explain what this is?
my swap is 300 and is running fine
It might be, that the size of the swap file isn't part of the problem, only a symptom and that rebooting cleans up stuff - and that is just a co-incidental thing with the swap file - and that's fine with me - wich leaves me to rephrase the question:
Best strategy to identify cause for large swap - or whatever it is that's making the system sluggish?
Well, another thing you could look at is de app.usage.cpu. This value should be as low as possible (between 0... 1) but it can be more than 1. That doesn't have to be a bad thing but if that's for a longer periode of time maybe you should restart that app.
In Settings -> System -> Stuff for geeks there is a loadavg. This shows 3 values. The first is the current cpu load and the last is the average for the last 15 minutes. You could also take a look at these values.